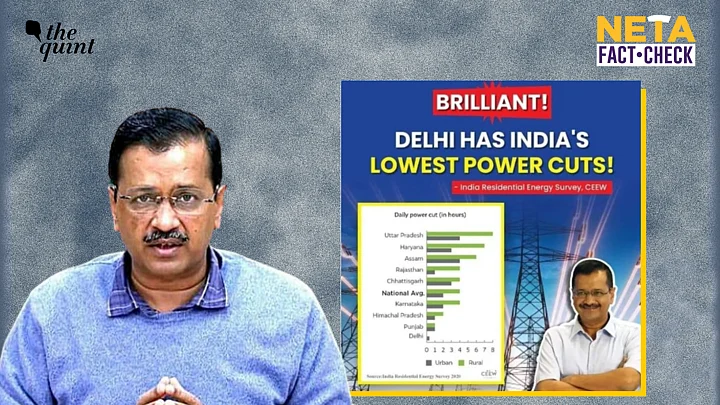
Delhi Chief Minister and Aam Aadmi Party (AAP) national convenor Arvind Kejriwal shared a graph on his Twitter handle which talked about daily power cuts in different states in India.
He claimed that the AAP governments in Punjab and Delhi were criticised for providing free electricity, and people suspected that both states will experience power cuts. But, both Punjab and Delhi experience the lowest power cuts in the country.
However, we found that Kejriwal's claims didn't align with the truth.
Firstly, the graph was published by Council on Energy, Environment and Water (CEEW) in 2020, when Punjab had a Congress government under the leadership of Amarinder Singh, and not AAP.
Further, the graph's screenshot has been manipulated to show Punjab on the second last position, while the original one showed Kerala.
What Has Kejriwal Claimed?
Kejriwal shared the graph on his Twitter handle lauding the state governments' efforts.
He uploaded it with a caption in Hindi and said, "Only Punjab and Delhi have free electricity in the whole country, and these two states have the least number of power cuts. Earlier people used to say that if free electricity is given, power cuts will increase. On the contrary, the power cuts have reduced. How?"
"Because in both these states, there is a government of Aam Aadmi Party of clear intention, honest and educated people. We have made the electricity sector efficient," it added.
Hints in Kejriwal's Post
At the bottom of the graph, the source of the graph was quoted as Indian Residential Energy Survey in 2020. The graph also carried a watermark of CEEW, which is a not-for-profit policy institution in Asia.
Taking this forward, we conducted a keyword search on Google and it led us to a report published on CEEW. The report was titled "State of Electricity Access in India" and was published in October 2020.
On going through the report, we found on page 16 that the data for the graph was collected between November 2019 and March 2020.
It should be noted that during this time Punjab had a Congress government being led by former CM Amarinder Singh.
Original Graph Altered
We found the original graph on page 19 of the report. On comparing the viral graph with the original one, we found both of them are different.
Team WebQoof also found several names of the states missing in the graphic of the survey. For example, Jharkhand can be seen below Uttar Pradesh in the original survey however it appears to be missing from the viral one.
A similar error can be seen between Assam and Rajasthan. Bihar seems to be missing from the graph. The original graph carried the figures for India, whereas the viral one had a "national average."
Another striking factor was the omission of names of the states - Tamil Nadu, Gujarat, and Kerala from the list - which in turn showed Punjab as the second last state.
The Quint has reached out to Kejriwal's office for clarifications/comments, and the story will be updated as and when it is received.
It's clear that Delhi CM Kejriwal shared an old and manipulated graph to make the misleading claim that Punjab and Delhi experiencing the lowest daily power cuts.
(Not convinced of a post or information you came across online and want it verified? Send us the details on WhatsApp at 9643651818, or e-mail it to us at webqoof@thequint.com and we'll fact-check it for you. You can also read all our fact-checked stories here.)