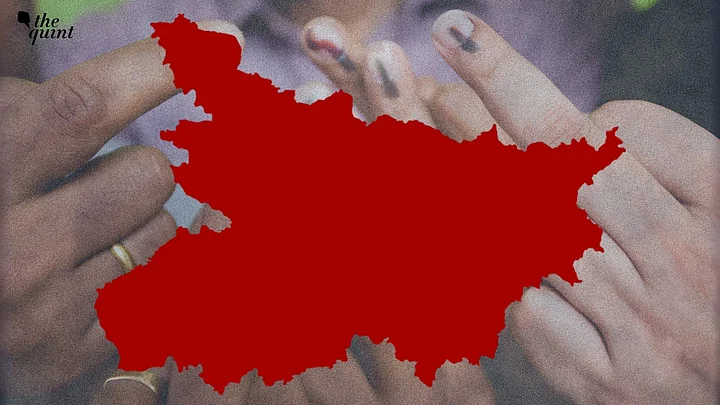
Bihar is back in the headlines—and so are all the numbers, charts, and claims flying around on your timeline. From crime stats to growth rates, everyone’s got their version of “the truth”.
Political parties have spared no effort in persuading the voters. The ruling NDA keeps highlighting development and reminding everyone of the ‘Jungle Raj’ years, while the Mahagathbandhan hits back, saying the government hasn’t solved Bihar’s real problems.
But when a large number of leaders are speaking, a large amount of data is being quoted, and a large amount of chest-thumping is happening, it becomes difficult for people like you and me to escape the maze we call ‘NUMBERS’. To tackle this problem, our fact-checking team at The Quint developed a data series to explain and break down the numbers.
The Illicit Liquor Story That Data Didn’t Fully Tell
On 19 June, we published our first story that talked about the number of cases and deaths in the state related to the consumption of illicit liquor.
On checking the National Crime Records Bureau (NCRB) website to find the exact number, we found that the figures were quoted low in some cases. While there were news reports of deaths due to the consumption of illicit liquor, the NCRB data did not reflect this.
Breaking Down the Economic Developments Under CM Nitish Kumar
In 2005, the state witnessed a paradigm shift under Kumar's leadership. The Janata Dal (United) (JDU) leader became the chief minister for the second time. However, unlike his first time, he was here to stay. This victory catapulted Kumar to the centre of state politics and kick-started his arguably unprecedented stronghold.
Team WebQoof examined how successful the JDU leader was in growing the state's economy. From FY13 to FY24, Bihar witnessed an average growth rate of 5.51 percent.
Tracking Per Capita Income Growth
We analysed how it changed between 2005 and 2024, asking: does a rise in income data reflect real improvement in people’s lives, or is it just another number in political speeches?
What Else We’ve Looked At
Till this month, Team WebQoof has published three more data-driven stories on:
This series was our team’s effort to inform our readers and help them stay away from mis/disinformation on social media platforms. The stories aimed to bring you the simplified numbers and facts, minus the noise and opinions.
Prebunking Tips: How to Stay Ahead of Election Misinformation
We know what happens during elections—the memes, the out-of-context data, the wild “development” claims.
Here’s how you can prebunk (not just debunk) such claims before they spread:
Double-check the source – Is that chart from the NCRB or an edited screenshot on X or WhatsApp?
Look at the timeline – Old stats often get shared as “latest” data.
Compare before you believe – Cross-check with government reports or credible media outlets.
Pause before sharing – If a number feels too convenient for one side, it probably needs a second look.
Who rules the state after the election is for the future to tell, but for the WebQoof team, bringing out the truth and factual information remains the topmost rule.
Is there something that we missed? Is there a story that we need to focus on? Do tell us by reaching out to us on our WhatsApp tipline number 9540511818.
A Side Note
The Trusted Information Alliance (TIA)'s flagship event, TIACoN 2025, is coming up soon on 6 November at the India Habitat Centre. The event will bring together journalists, technologists, policy experts, creators, and researchers to explore the future of information and trust in the AI age. Expect practical discussions, honest debates, and real solutions — from tackling deepfakes and deceptive design to empowering consumers with tools for digital literacy.
Apply here to join the event: https://forms.gle/USZ8APZTq7ynzdUN9
(Not convinced of a post or information you came across online and want it verified? Send us the details on WhatsApp at 9540511818 , or e-mail it to us at webqoof@thequint.com and we'll fact-check it for you. You can also read all our fact-checked stories here.)
