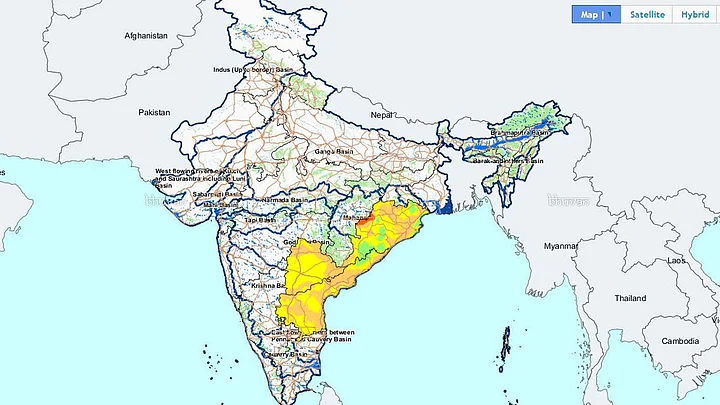
The heatwave sweeping across South India can now be tracked by an interactive heat visualisation map created by the Indian Space and Research Organization ( ISRO).
The map displays the intensity of heat across the regions of Andhra Pradesh, Telangana and Odisha which are the most affected by the wave.
ADVERTISEMENTREMOVE AD
The heatwave can be tracked on any day from 19 April onward.
The map is colour coded based on the classifications of intensity – No Heatwave, Heatwave, Severe and Extreme.
ADVERTISEMENTREMOVE AD
According to The Indian Express, 2016 was recorded as the warmest year for India so far. The mercury peaked over 45 degrees Celsius in some parts of Odisha and Telangana, where over 100 deaths were reported.
Read Latest News and Breaking News at The Quint, browse for more from news and india
Topics: ISRO South India Heatwave
Published: